
Expectations for rich content and interactive web apps are growing steadily. This demand has led to the rise of heavy front-end frameworks that provide many opportunities for performance bottlenecks if developers and ops teams do not take the time to build and ship the code properly.
For those of us lucky enough to be part of a work culture that promotes taking time to consider performance impacts of code changes, it can still be difficult to know where to start. In this post, you will discover how page load time, time to first byte, perceived performance, API requests, caching, and UI responsiveness affect a user’s experience. Each of these metrics contribute to performance in different ways, so it is important to consider them individually in order to measure their impact and make a plan for improvement.
When evaluating these metrics, we should also consider different strategies for measuring performance. For example, you may have accessed your website or web app from home or work with high-speed internet connectivity and observed that it loaded very quickly. However, you may see a different story if you access it on your mobile phone while out of 4G/LTE range, at a crowded coffee shop, or during a music festival. When testing web performance, it is important to check various locations and network conditions. After all, it doesn’t matter how fast your site loads for you if your customers are having a bad experience.
Page Load Time
Perhaps the most obvious performance metric is page load time. How long does it take from the moment I request your website until the site finishes loading? Page load time can be affected by a variety of conditions including network speeds, server load, long-running API requests, and how much data must be downloaded in order to display the page. Developers get accustomed to having top-of-the-line hardware and fast internet connections. It is easy to ignore how quickly file sizes add up when considering all of the images, CSS, HTML, fonts, and JavaScript needed to view a webpage. We should never lose sight of the fact that our customers have to download all of this data before they can view our site or use our web app.
Let’s take a peek at the page load time for the Cantina website. I am using Google Chrome’s DevTools, but the process is similar for other browsers. Right click in the browser window and select Inspect. Select the Network tab and refresh the page (⌘R on macOS, F5 on Windows). You should see something similar to the screenshot below.
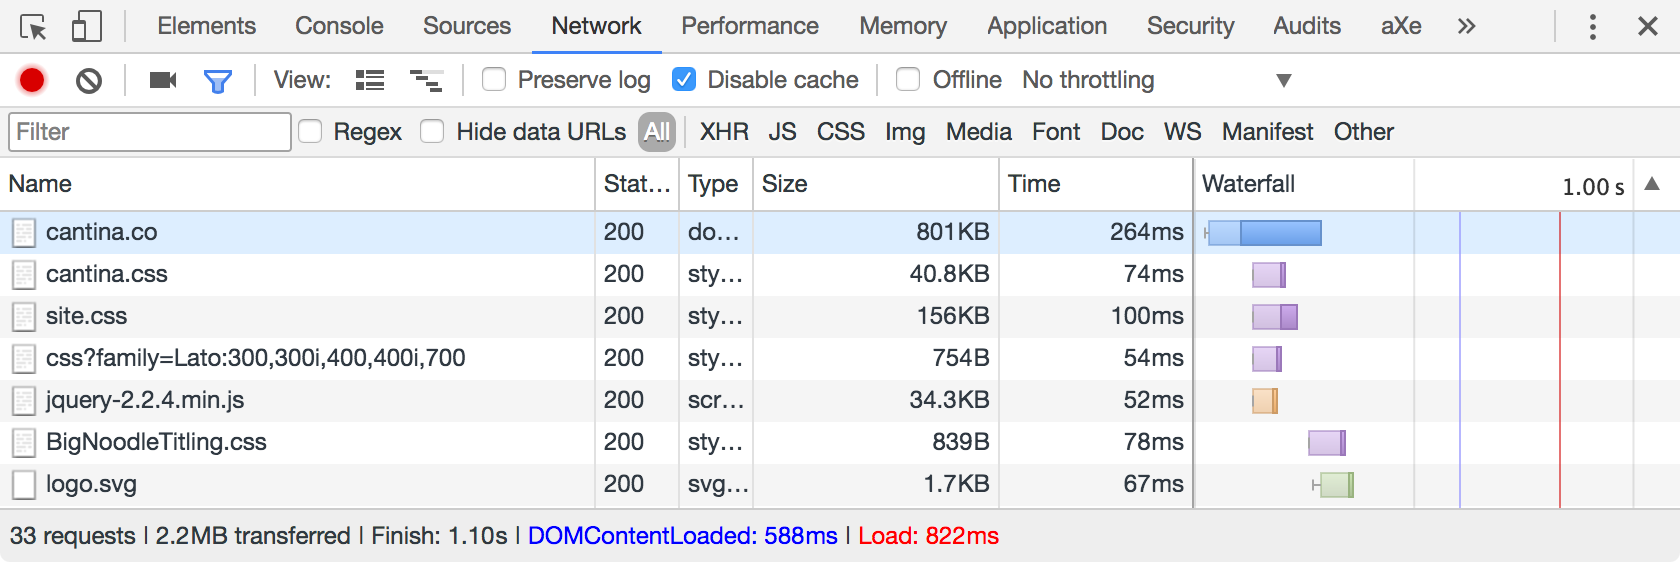
Timing values will vary based on network conditions, so it is a good idea to take several readings.
At the bottom of the DevTools pane, you can see the total number of requests made, the total number of bytes that were loaded, and three time measurements labeled Finish, DOMContentLoaded, and Load. Finish marks the time when all assets and asynchronous requests have returned. DOMContentLoaded marks the time when the initial markup of the page was parsed, which was a good metric 15 years ago but is not very helpful if your site uses any JavaScript. Load marks the time when the HTML and all blocking requests have completed (downloading CSS, images, JS files, etc).
If the content on the page does not rely on asynchronous JavaScript requests, then the Load time is a good measure of your page load speed. However, if your page renders content that comes back from asynchronous JavaScript requests, the Finish time may be a more meaningful number.
Time to First Byte
Time to first byte (TTFB) measures how long it takes from the moment I request your website until I start receiving the first byte of data. This will always be when the HTML for your page is being sent because that is the file that tells the browser what other assets should be fetched.
TTFB factors into the loading time we just talked about, but I like to look at it separately to get a better picture of how we can improve performance. Unfortunately, TTFB is highly dependent on server hardware, the customer’s network speed, and any network congestion between the customer and your server(s). The only feasible way to improve your TTFB is by using a CDN to locate your static assets closer to your customers so that they can be delivered faster. If you’re already using a CDN, there isn’t much you can do to improve TTFB aside from spending large amounts of cash on better server hardware. For this reason, I prefer to subtract the TTFB from the page load time of a site to get a better picture of what can realistically be improved.
Page load time – Time to First Byte = Amount of page load time that can be improved
Perceived Performance
Another important (albeit less straightforward) metric is perceived performance. Your customers are probably humans who don’t think in terms of how many milliseconds it took for a browser event to be triggered. Although a site may take several seconds to load, it can feel like it loaded quickly if you saw most of the page load up front. If your site or application depends on one large API request to get all of its information, it is going to feel slow because your customers will be staring at a blank page until all of the content finally pops onto the screen.

Perceived performance can be measured using a combination of the Start Render and Visually Complete times. You can use a stopwatch to measure when you no longer see a blank page (start render) and when the page is fully loaded (visually complete). You can also dive into the Performance tab of Chrome DevTools and check when the first render occurs and when the last render completes. Or you can just use WebPagetest! This helpful open-source tool loads your site, measures its performance, and gives you a detailed analysis. It allows you to set various network conditions, test with different browsers, and access your site from different locations in the US and around the world.
WebPagetest also calculates a SpeedIndex rating, which is the best evaluation of perceived performance that I have come across. You can read more about SpeedIndex in the WebPagetest documentation. What it boils down to is charting the percentage of the page that has been visually loaded (shown on the y axis) versus time (x axis) and taking the area above the curve. The SpeedIndex will be lower for pages that start rendering the majority of their content quickly, which correlates to better perceived performance.
API Requests
Earlier, I mentioned that the load event is not a good indicator of your actual page load time when the page contains asynchronous API requests that load content. This is because the browser’s load event is fired when all blocking requests are complete. Asynchronous requests are non-blocking, so they can continue to cause delays even after the load event has fired.
API requests are much more common with web apps than the typical website, but they may still cause issues for your website. You can tell if your site is making API requests on a given page by inspecting the network tab of your browser’s developer tools. Using Chrome DevTools, select the Network tab and click the XHR button on the filter bar (if you do not see the filter bar, you can click the filter icon to display it). This will filter the list of network requests to only show API requests (XHR is shorthand for XMLHttpRequest).
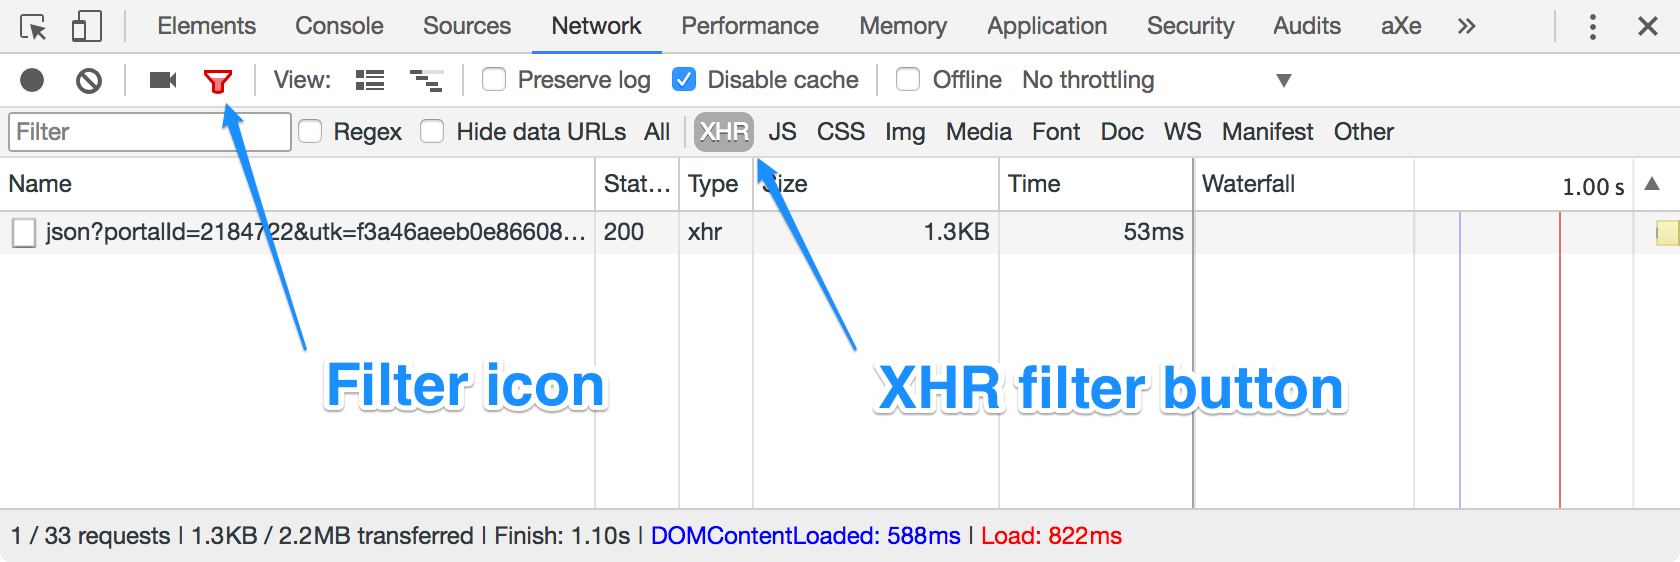
Look for any requests that are taking more than 100 milliseconds. This measurement can be found in the Time column shown above (right click any column heading and select Time if it is not visible).
If you do find slow-running API requests, then you need to dive deeper into your middleware services or backend to see why. API request payloads are usually lightweight (check the Size column for the request) and are not significantly affected by network conditions, so there isn’t much we can do on the front-end to improve them. However, you can check whether the requests are being made concurrently or in series. It is also a good idea to sort the requests by name in the Network tab so you can see if the same request is being made repeatedly. If so, you are tying up network resources that could be freed by caching the response in the front-end code so it does not have to get requested more than once.
Caching
Improving a poor or non-existent caching strategy is one of the easiest ways to speed up your web performance. How do you tell if you are doing caching correctly? The easiest way to check is to follow these steps:
- Clear your browser’s cache
- Load your website or app
- Record the page load time
- Refresh the browser (⌘R on macOS, F5 on Windows)
- Load your website or app
- Record the page load time
If the page loads almost instantly the second time, then you probably have a pretty good caching strategy. Otherwise, there are a few things you can look into. First, you’ll want to narrow down all of the network requests that are not cached. To do this, open up the Network tab in Chrome DevTools and select All from the filter pane (see the API Requests section above for instructions on how to show the filter pane). You should see something like the screenshot below.
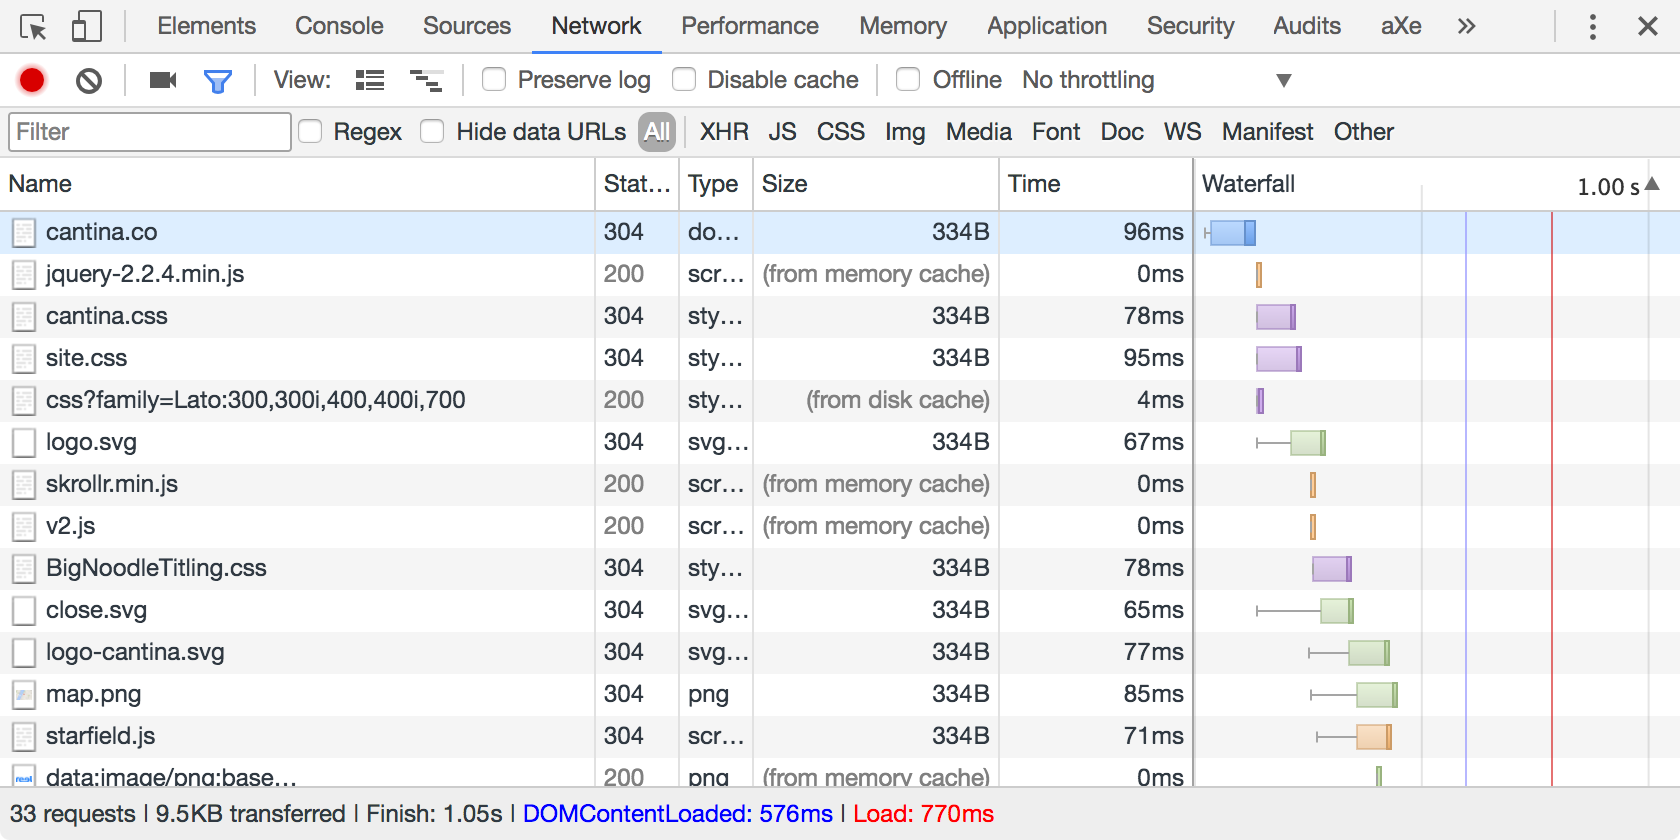
Look for any network requests that are not marked “(from disk cache)” or “(from memory cache)” in the Size column. You want all images, stylesheets, fonts, and javascript files to be cached, but don’t worry if you see some things like API requests or Google Analytics trackers that don’t show as cached — that is normal. We will dive deeper into caching strategies in a future post, but also know that any resources with a status of 304 Not Modified are cached as well.
UI Responsiveness
The most important stat is response time. Whether we’re requesting a page or interacting with the UI, we want it to respond as quickly as possible. Much of what we know about human perception of web response time comes from Jakob Nielsen’s article, Website Response Times:
- Responding to GUI actions (such as a mouse click or a key press) within 100 milliseconds feels instantaneous.
- It still feels acceptable if the site responds within 1 second. This should be your upper limit.
- You’ve lost your customer’s attention after 10 seconds and they are probably going to leave your site if they haven’t already.
Jakob didn’t say what happens between 1 and 10 seconds, but I’m fairly certain the customer is muttering things under their breath during this time. Things can get a bit more dire with mobile users. A more recent study of mobile users revealed over half of mobile users will give up and leave your site if it has not loaded within 3 seconds.
Another way to look at this is the RAIL model by Paul Irish and Paul Lewis. RAIL stands for response, animation, idle, and load. This model categorizes user interactions into measurable goals:
- Response: show feedback within 100 milliseconds of a user interaction (touch, click, etc.)
- Animation: animations should be smooth and rendered at 60 frames per second, so each frame should be completed in 16 milliseconds or less (1 second ÷ 60 fps = 16.6 ms per frame)
- Idle: complete work in small chunks during idle time so as not to interrupt the user experience
- Load: The page should load and render something meaningful within 1 second
Unfortunately, I don’t have a magical tool that gives all of the numbers we want to look at for UI response time. I’ve found that you can usually get a good sense of whether you have responsiveness issues by browsing the website or using the web app on various devices. There are times when you want to get the exact numbers – usually when considering frame rendering. We can see the frames under the Performance tab of Chrome DevTools. You may need to refresh the page after switching to the Performance tab as it is not enabled by default.
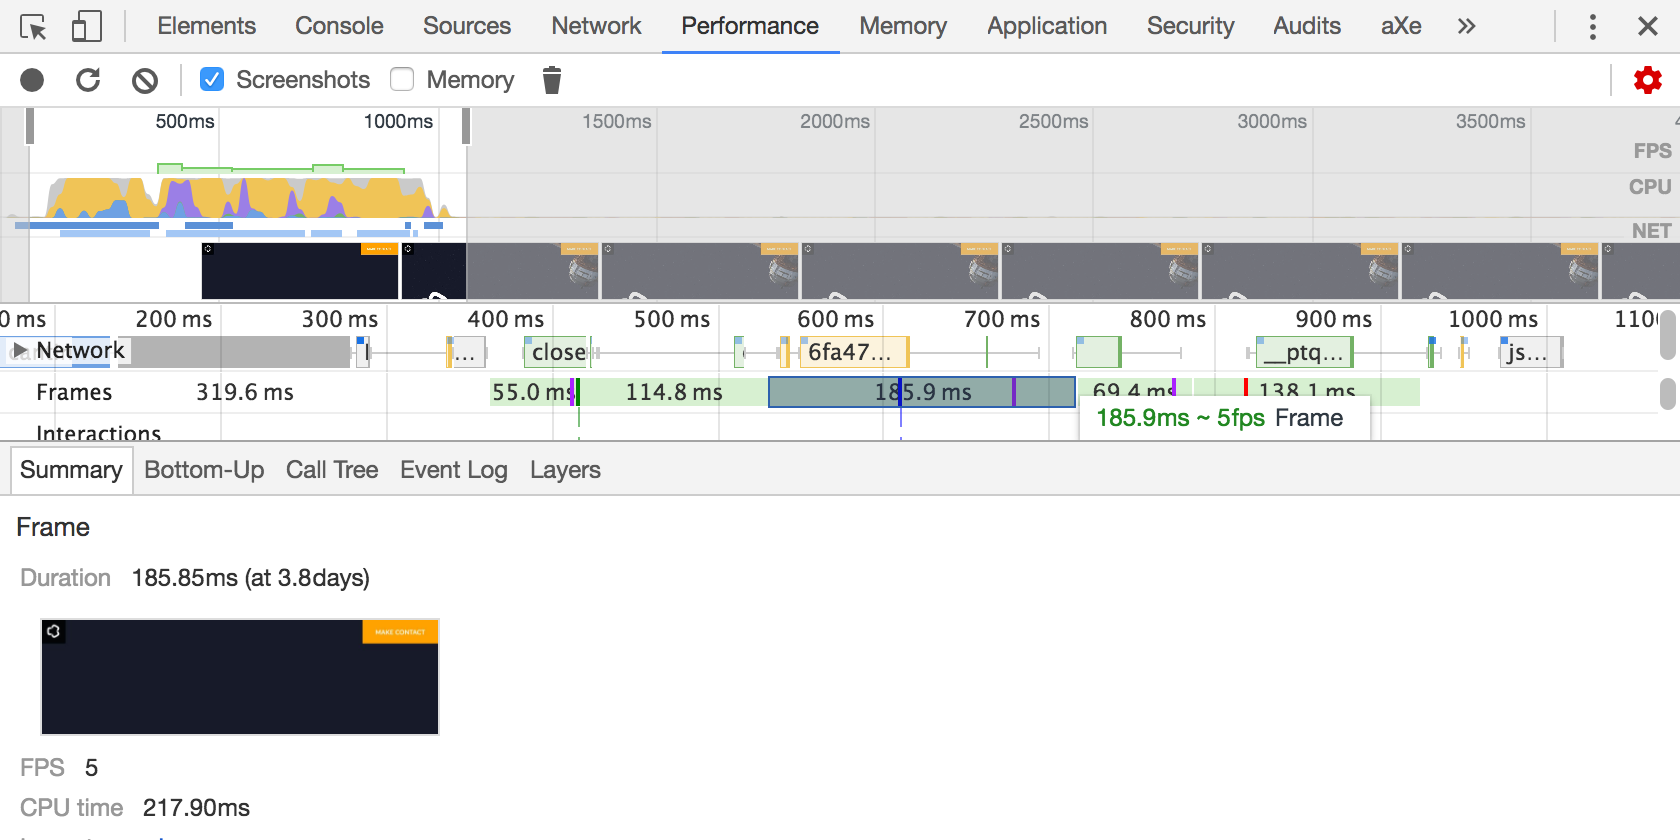
The frame render times are listed in the Frames row below the timeline. Hovering over one of the frame blocks will show a tooltip with the fps and clicking the block will display a summary at the bottom of the window. You can see that our homepage has several frames that are rendering at 5fps. That is quite a bit lower than the 60fps mentioned above, but it isn’t the end of the world since the images on the page are not animating. Even so, we could stand to optimize those a bit!
What’s Next?
You are now armed with tools to evaluate the performance of your website or web app. You know how page load time, time to first byte, perceived performance, API requests, caching, and UI responsiveness provide insight into web performance in different ways. You see the benefit of performance testing with various devices and network conditions to get a more accurate sample of your customers’ experiences.
Stay tuned for the remainder of this series where we will discuss methods to resolve the performance issues you are sure to discover. We will be taking a deeper dive into browser caching, asset optimization, preventing redundant API requests, batch processing, lazy loading assets, pre-caching, and JavaScript performance.